1. Rate of reaction
Rate of reaction can be defined as change in concentration in unit time. And it can be specified in reactant or product. Both increase in concentration of product and decrease in concentration of reactant in unit time can be used to describe rate of reaction, and shown in Figure 1.
Base on the definition, the unit of rate of reaction is mol dm-3 s-1. Some other units of time can be applied as well, such as mol dm-3 min-1 and so on. Because it is difficult to measure the real-time concentration change in aqueous solution, some other physical quantities, such as pH value, electrical conductivity, color intensity, can be used in the unit of rate of reaction.
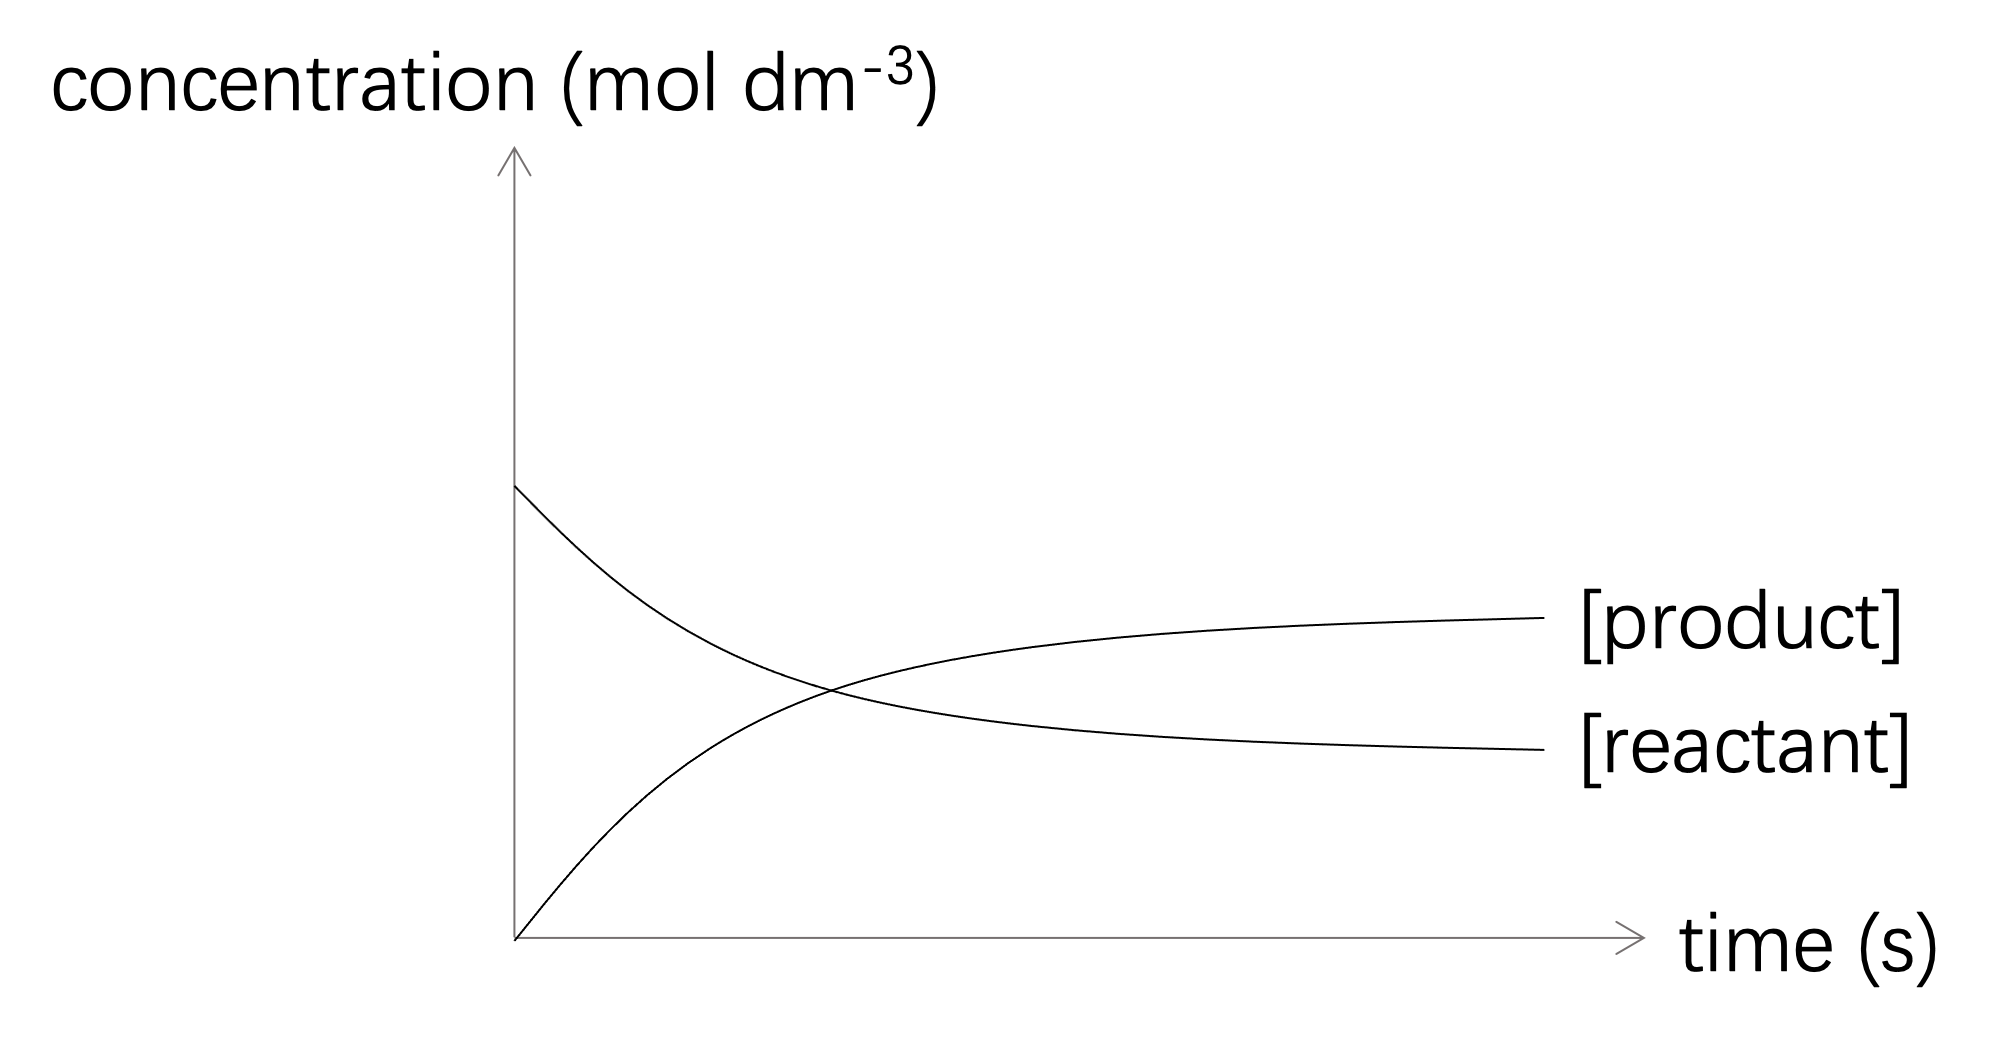
Figure 1: Concentration of reactant and product against time
Definition
Rate of reaction: increase in concentration of product in unit time. (or decrease in concentration of reactant in unit time.)
Sub Heading 2
Repurposing scrum masters and possibly create a better customer experience. Amplify cloud computing to in turn be on brand.
Sub Heading 3
Create cloud computing and then think outside the box. Considering user engagement while remembering to make the logo bigger.
2. Calculate rate of reaction
There are two types of rate of reaction: average rate and instantaneous rate.
The formula of average rate can be deduced from the definition and shown below, and data can be found from Figure 3:
![]()

Figure 3: Calculate average rate of reaction from diagram
The instantaneous rate can be deduced from the limitation of average rate when Δt close to zero (![]() ). According mathematical knowledge, this value is equal to the slope of the tangent line at this specific time and shown in Figure 4.
). According mathematical knowledge, this value is equal to the slope of the tangent line at this specific time and shown in Figure 4.

Figure 4: Calculate instantaneous rate from diagram
Based on Figure 4, the instantaneous rate can be calculated by Δc over Δt as well.
According to Figure 4, we can find the instantaneous rate decreases with time taken. This is due to the consumption of reactant. Finally, the line will become a horizontal line because the reaction is complete.
In a chemical reaction, consumption of each reactants are different in unit time. So the rates of reaction are varied for different reactants, but they can convert using coefficient in the chemical equation.
Sub Heading 1
Engage big data yet re-target key demographics. Generating brand integration while remembering to re-target key demographics.
Sub Heading 2
Repurposing scrum masters and possibly create a better customer experience. Amplify cloud computing to in turn be on brand.
Sub Heading 3
Create cloud computing and then think outside the box. Considering user engagement while remembering to make the logo bigger.
3. Measure rate of reaction
The common definition of rate of reaction is concentration change. Actually, it is impossible or difficult to measure the concentration of reactant or product in aqueous solution directly. Some other physical quantities can be used to measure rate of reaction as well, such as change in electrical conductivity, pH value, color intensity, and so on.
Notice: when you are required to describe how to collect data to measure the rate of reaction, do not forget terms such as in unit time, per unit time, stopwatch and so on.
(1) Volume of gas produced in unit time.
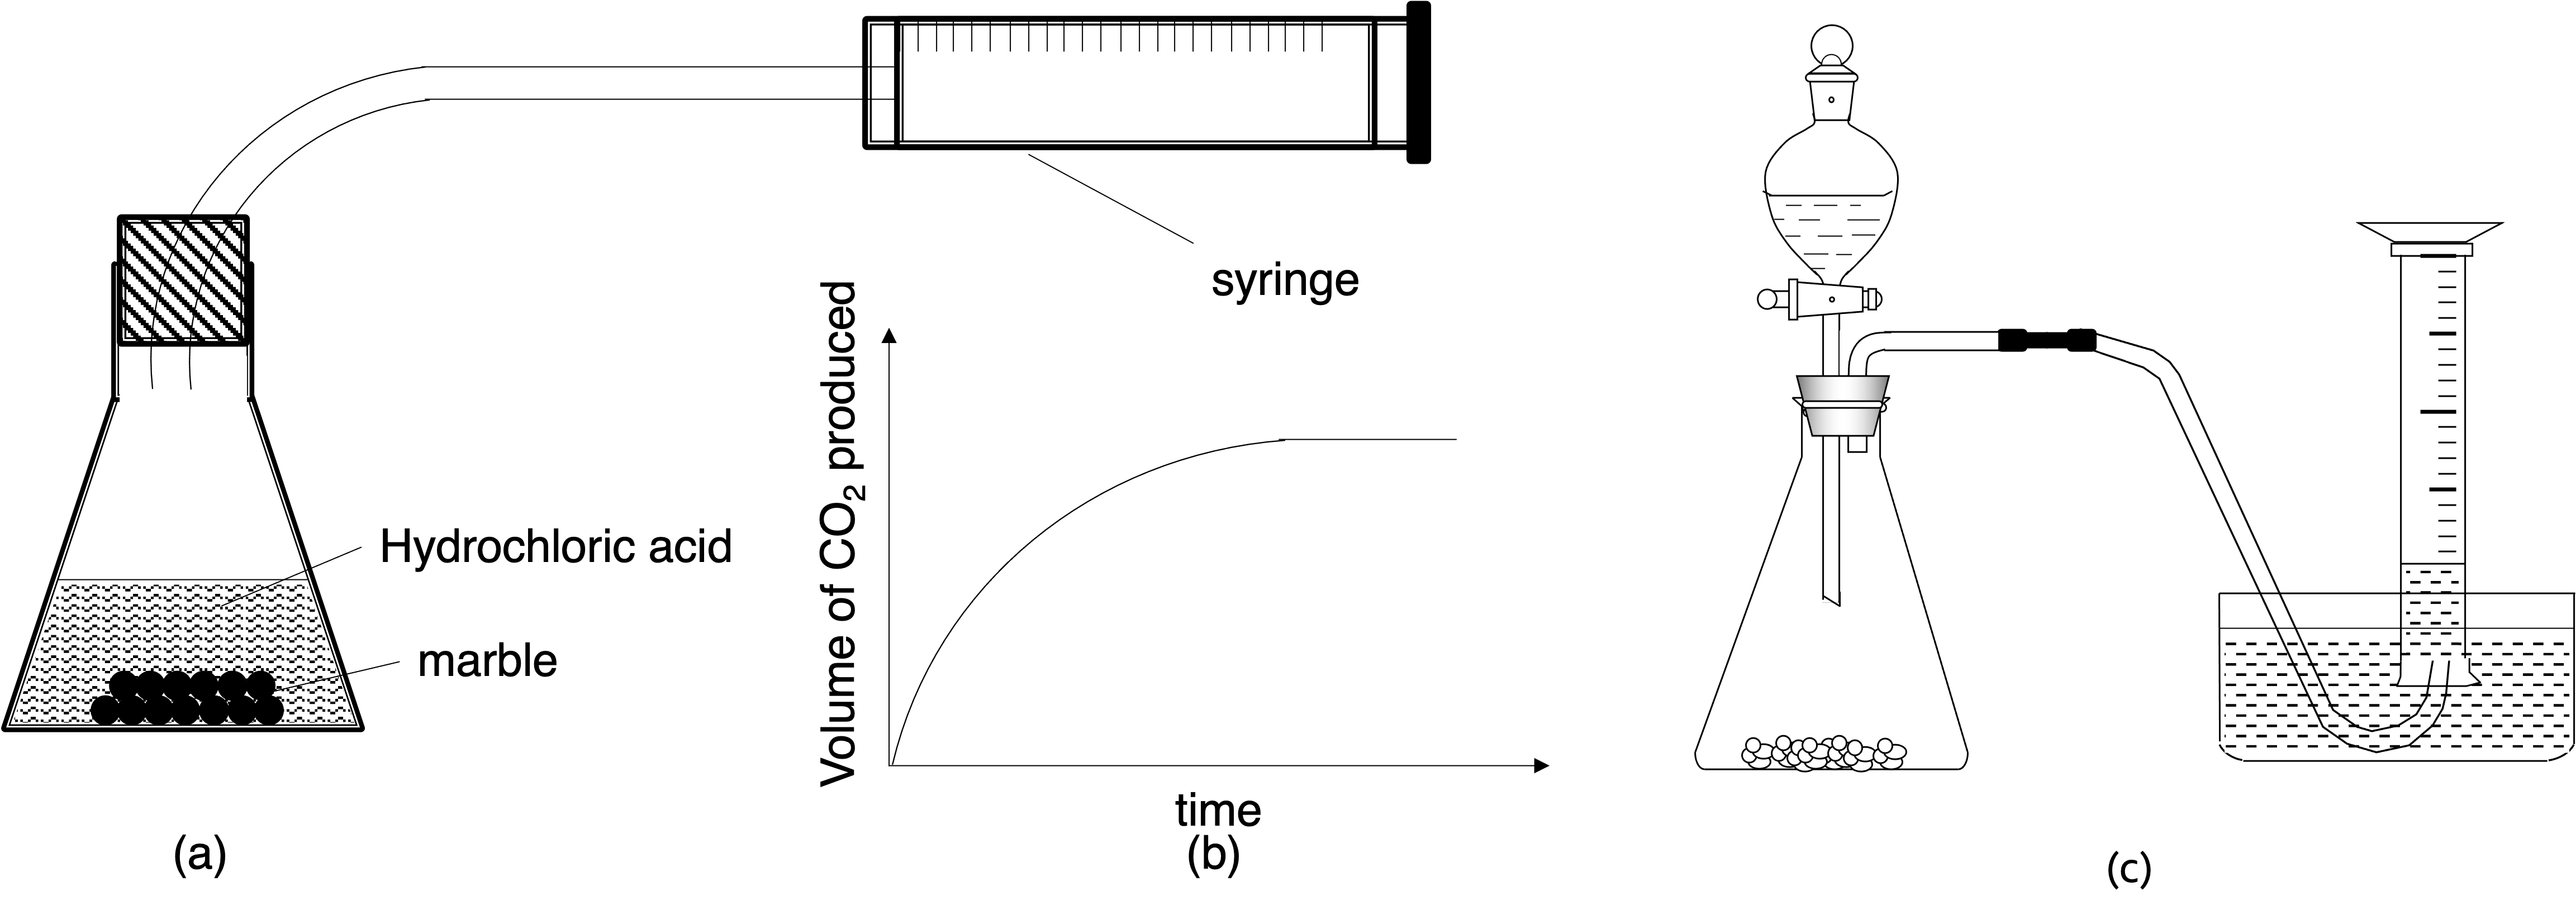
Figure 5: Apparatus for measuring rate of reaction by volume of gas produced in unit time (click picture to enlarge)
Figure 5 (a) and (c) show two apparatus to collect gas produced during chemical reaction. Some gases, such as NH3 (ammonia) and CO2 (carbon dioxide), are dissolved in water, apparatus (c) cannot adapt for these gases collection. And apparatus (a) has widely usage. The volume of gas produced against time was shown in Figure 5(b).
(2) Mass of reaction mixture in unit time.
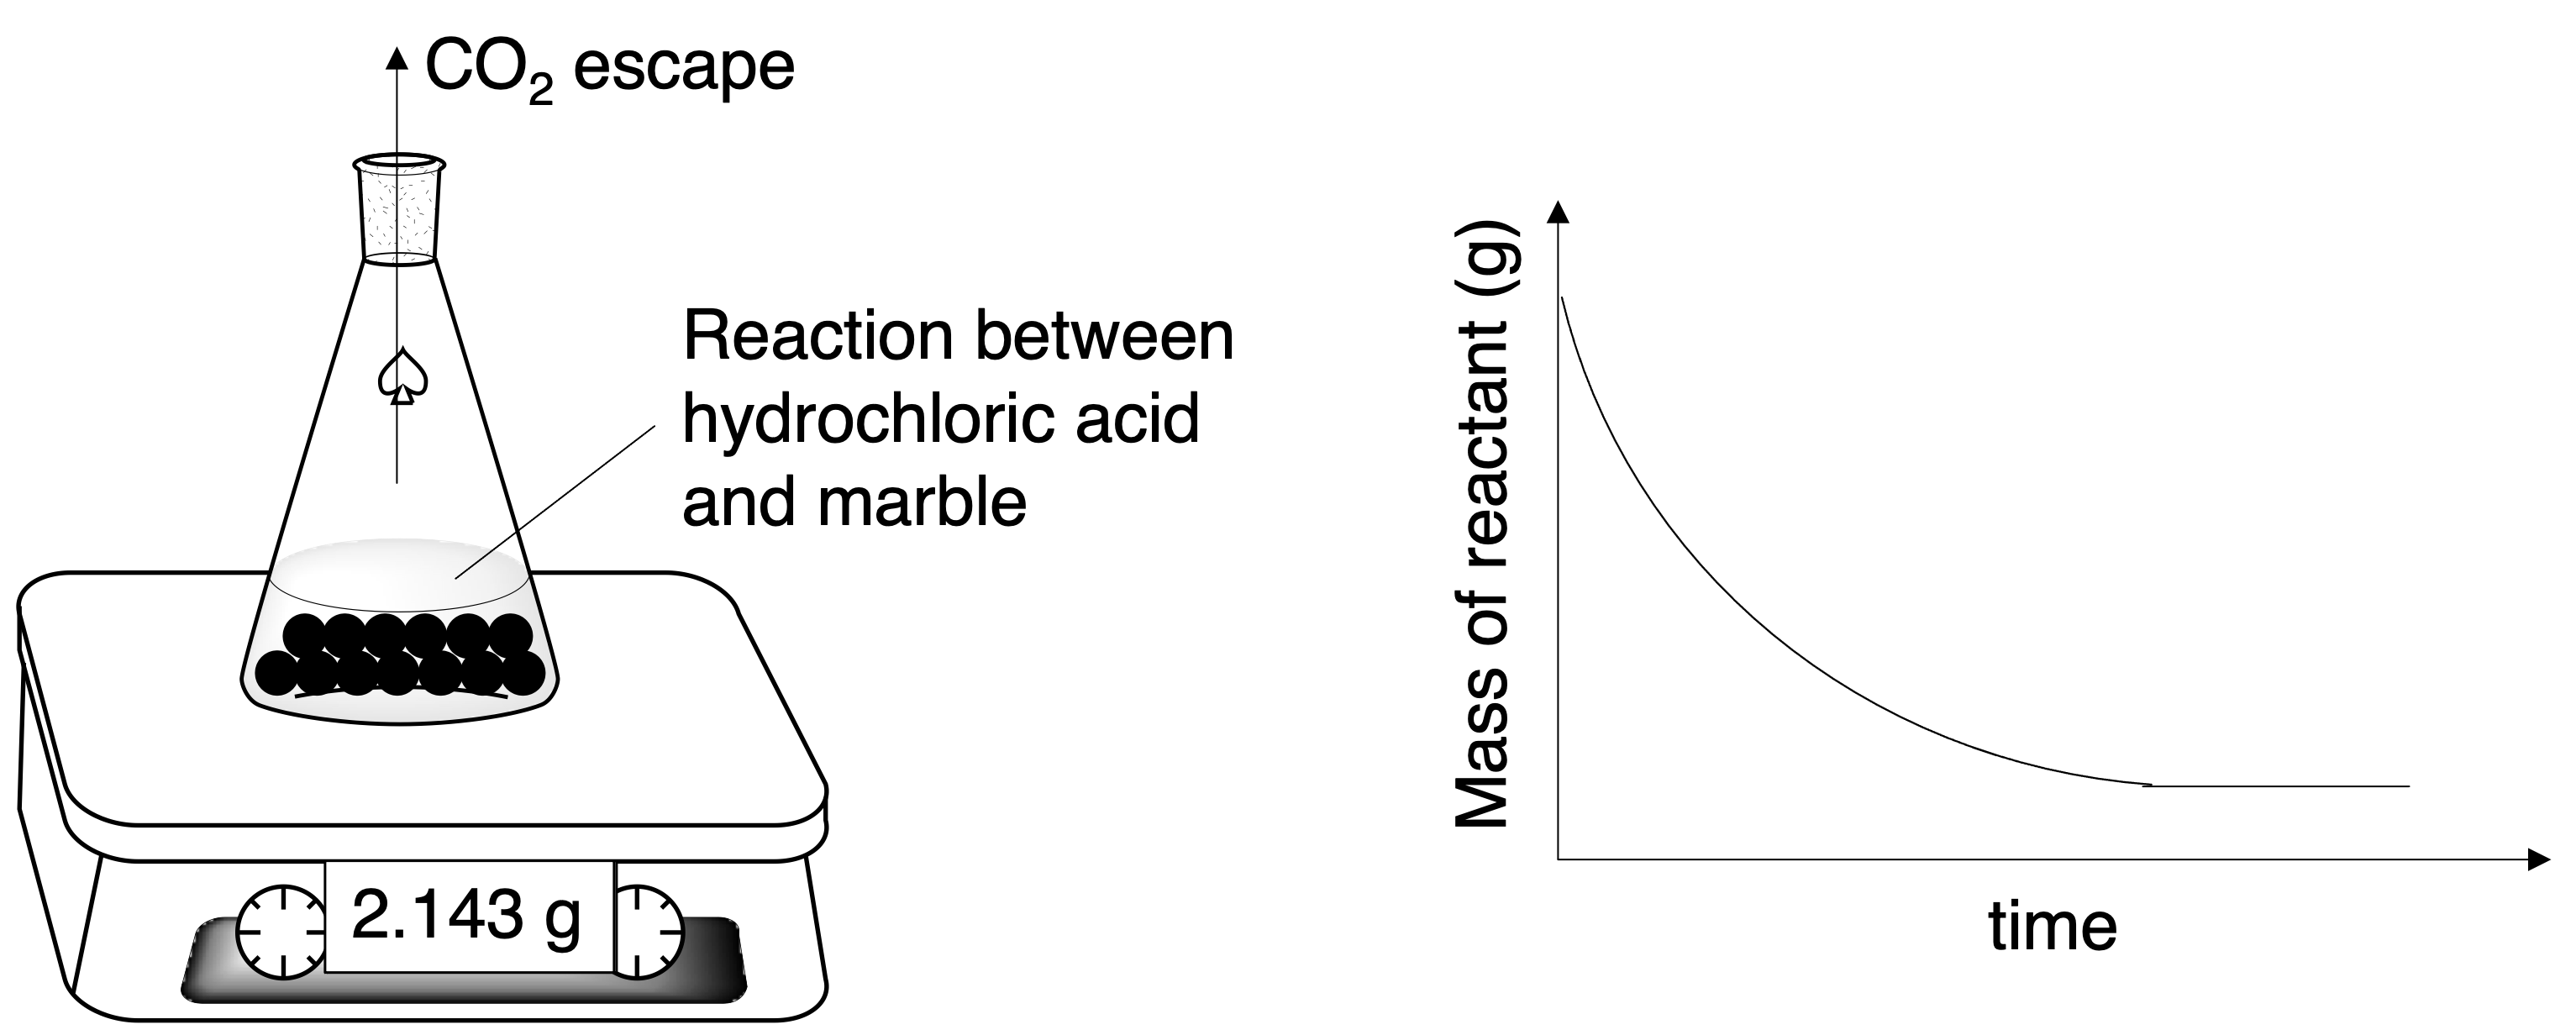
Figure 6: Apparatus for measuring rate of reaction by change in mass in unit time
Both method (1) and (2) are suitable to measure the rate of reaction which can produce gas. But method (2) cannot use to measure the reaction rate which produce gas which has small molar mass ,such as hydrogen gas, because the change in mass will not be obvious.
(3) Change in electrical conductivity in unit time.
Change in electrical conductivity in unit time can be used to measure the reaction rate which has greater change in number of ions before and after reaction. For example,
5C2H5OH + 4MnO4– + 12H+ → 5CH3COOH + 4Mn2+ + 11H2O
(4) Change in color intensity in unit time.
Change in color intensity in unit time can be used to measure the reaction rate which has change in color intensity during reaction. This method prefers to color change from colorless to one color, or from one color to colorless. This method is not suitable for the reaction from one color to another color, but still can be applied. For example,
5C2H5OH + 4MnO4– + 12H+ → 5CH3COOH + 4Mn2+ + 11H2O
purple to colorless
CuSO4(aq) + Zn(s) → ZnSO4(aq) + Cu(s)
blue to colorless
Cl2(g) + 2NaBr(aq) → 2NaCl(aq) + Br2(aq)
colorless to yellow
(5) Other change in physical quantities in unit time
Some other quantities, such as pH value, pressure, can be used to measure the rate of reaction.
(6) Clock technique
Actually, whatever concentration or other physical quantities, it is still impossible to measure with a small interval. And we can set an end-point for a chemical reaction, and compare the reaction rate at different conditions. This method is called clock technique.
Most chemical reaction can use clock technique to compare the reaction rate at different conditions. For example,
CaCO3(s) + 2HCl(aq) → CaCl2(aq) + H2O(l) + CO2(g)
Option 1: Time taken when solid CaCO3 is disappeared if CaCO3 is limiting reactant.
Option 2: Time taken when 5 mL of CO2 was produced.
These two options can draw the same conclusion: faster reaction, less time taken.
Sub Heading 1
Engage big data yet re-target key demographics. Generating brand integration while remembering to re-target key demographics.
Sub Heading 2
Repurposing scrum masters and possibly create a better customer experience. Amplify cloud computing to in turn be on brand.
Sub Heading 3
Create cloud computing and then think outside the box. Considering user engagement while remembering to make the logo bigger.
4. Collision theory
A chemical reaction can be explained by collision theory. There are three statements in collision theory to explain why a chemical reaction can happen.
(1) Particles should collide each other;
(2) with sufficient energy (≥ Ea);
(3) with correct collision orientation.
Not all collision can cause a reaction happen. The collision with sufficient energy and correct orientation can cause a reaction and called effective collision. More effective collision in unit time can speed up a chemical reaction.
The energy here is kinetic energy which is related to motion. Higher speed of particles, greater kinetic energy. The distribution of kinetic energy in one substance under a specific temperature can be described by Maxwell-Boltzmann distribution and shown in Figure .
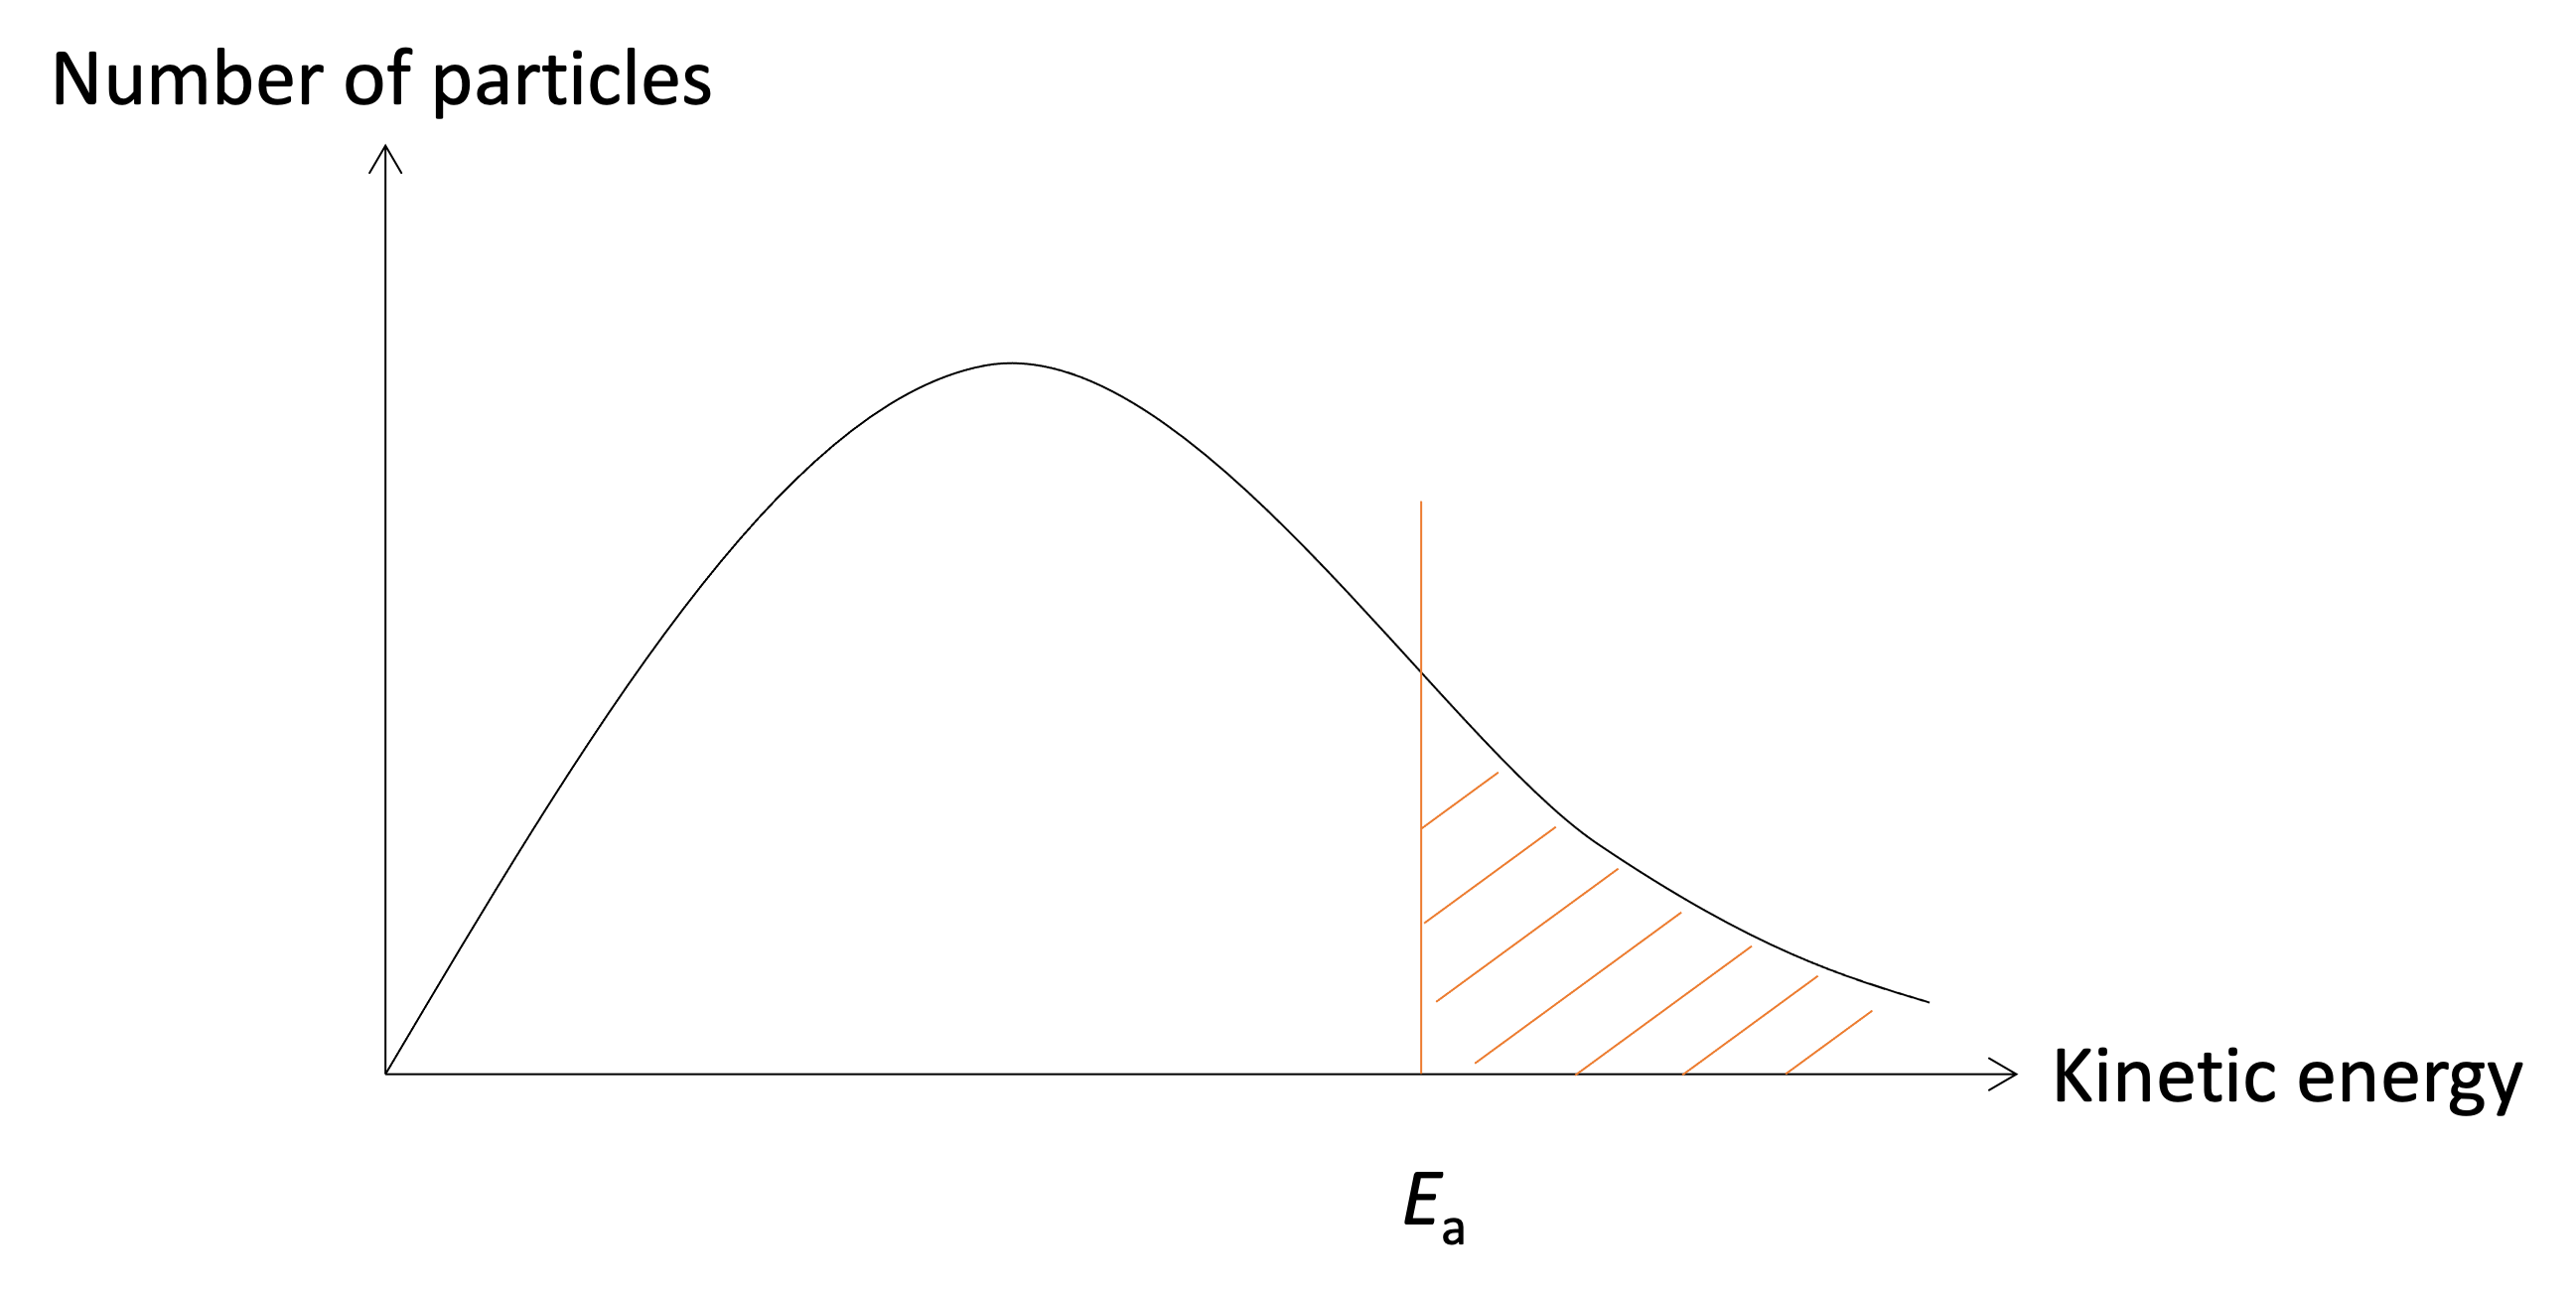
Figure: Maxwell-Boltzmann distribution curve under specific temperature
Some features on Maxwell-Boltzmann distribution curve should be noticed: 1) The curve should be from original point; 2) The curve should be close to x-axis finally, but does not cross with x-axis. Only particles with sufficient energy can occur effective collision and labelled on the graph by orange dash area.
Sub Heading 1
Engage big data yet re-target key demographics. Generating brand integration while remembering to re-target key demographics.
Sub Heading 2
Repurposing scrum masters and possibly create a better customer experience. Amplify cloud computing to in turn be on brand.
Sub Heading 3
Create cloud computing and then think outside the box. Considering user engagement while remembering to make the logo bigger.
5. Factors affect rate of reaction
Five factors will be discussed: concentration, pressure, surface area contacted, temperature and catalyst.
Concentration, pressure and surface area can increase the reaction rate due to the collision frequency, and catalyst can speed up the reaction which is related to particles with sufficient energy. Temperature is more complicated and can increase rate from both these two aspects.
(1) Concentration
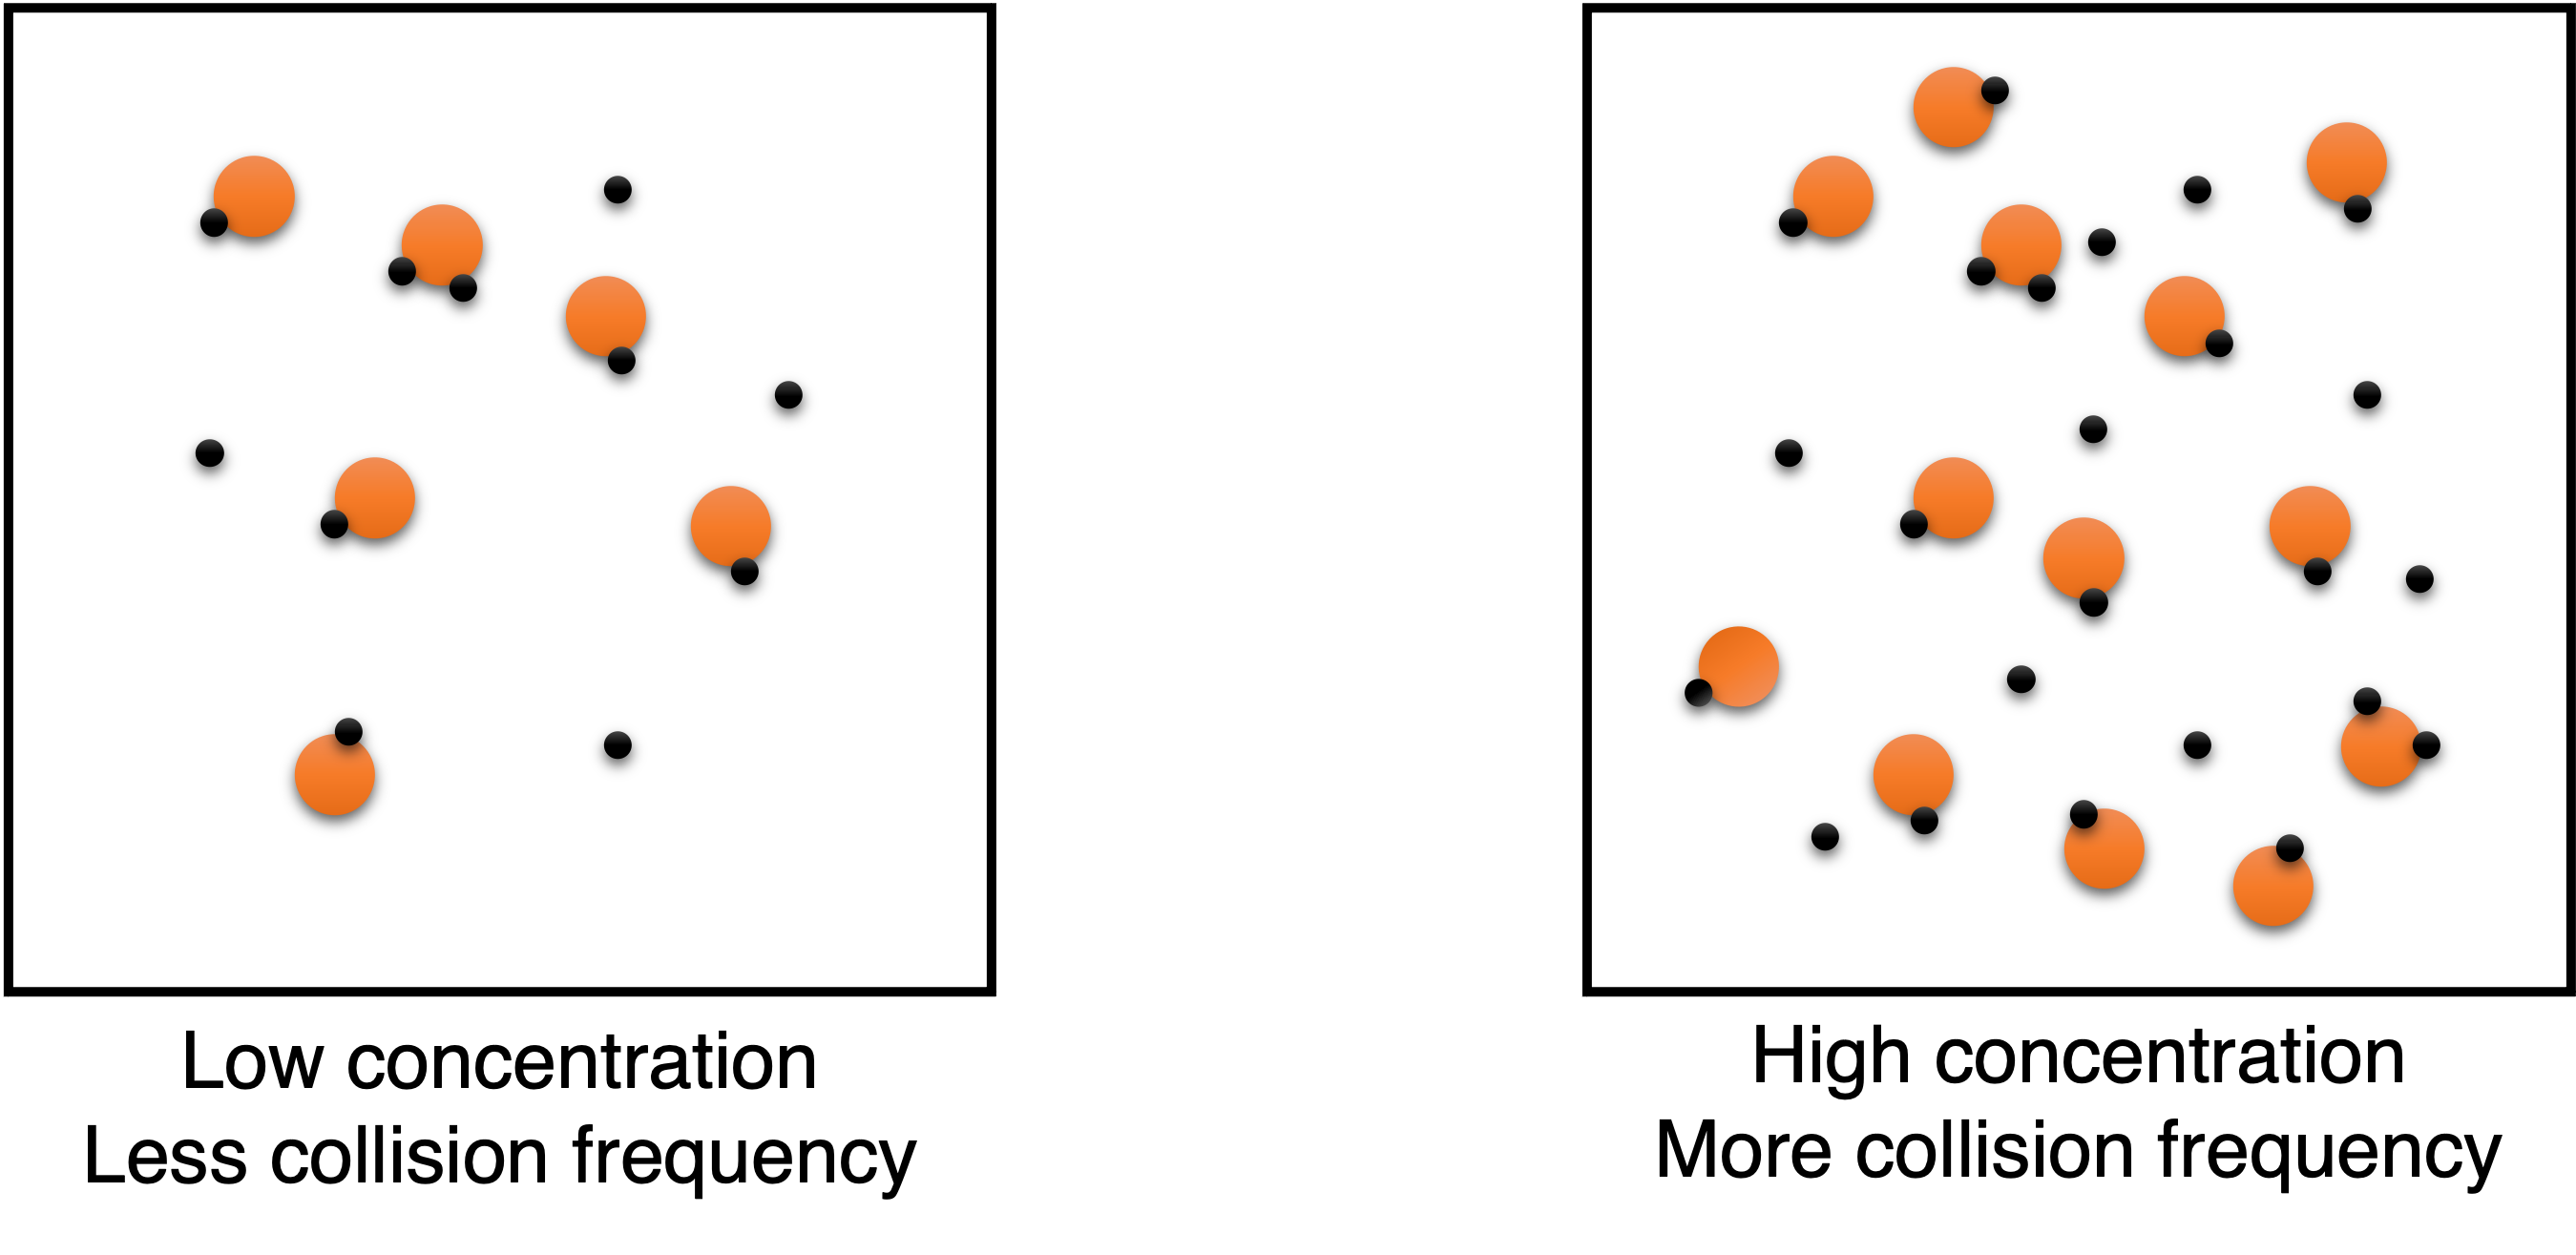
Figure
Figure shows how increasing concentration affect the reaction rate. More particles in unit volume when concentrations of reactants increase, therefore, more collision frequency, and more effective collision in unit time.
(2) Pressure
Pressure can affect the reaction involving gaseous reactants, and be similar with concentration. There are three types of method to increase the pressure of gas: (a) more gaseous particles in rigid vessel; (b) compress the volume; and (c) addition of some noble gases, and only first two methods can speed up the reaction rate. The explanation is similar with concentration.
(3) Surface area contacted
Surface area contacted can increase the rate for heterogeneous reaction. Heterogeneous reaction is the reaction that reactants are under different physical states (or phases). For example,
solid reacts with liquid: CaCO3(s) + 2HCl(aq) → CaCl2(aq) + H2O(l) + CO2(g)
gas reacts with liquid: CO2(g) + Ca(OH)2(aq) → CaCO3(aq) + H2O(l)
solid reacts with solid: Ba(OH)2(s) + NH4Cl(s) → BaCl2(aq) + NH3(g) + H2O(l)
liquid reacts with liquid: saponification: oil(l) + NaOH(aq) → soap + H2O(l)
Different types of heterogeneous reactions can be sped up by several strategies. When solid reactant react with aqueous solution, we can try to decrease the particle size. When gas reacts with liquid, the gaseous reactant can bubble into the liquid to increase the reaction rate. For immiscible liquids, we can stir the reaction mixture.
Explanation is similar. More surface area contacted, higher collision frequency.
(4) Temperature
The effect from temperature is more complicated. Based on Maxwell-Boltzmann distribution curve (Figure), higher temperature will cause more particles have sufficient energy to overcome activation energy.
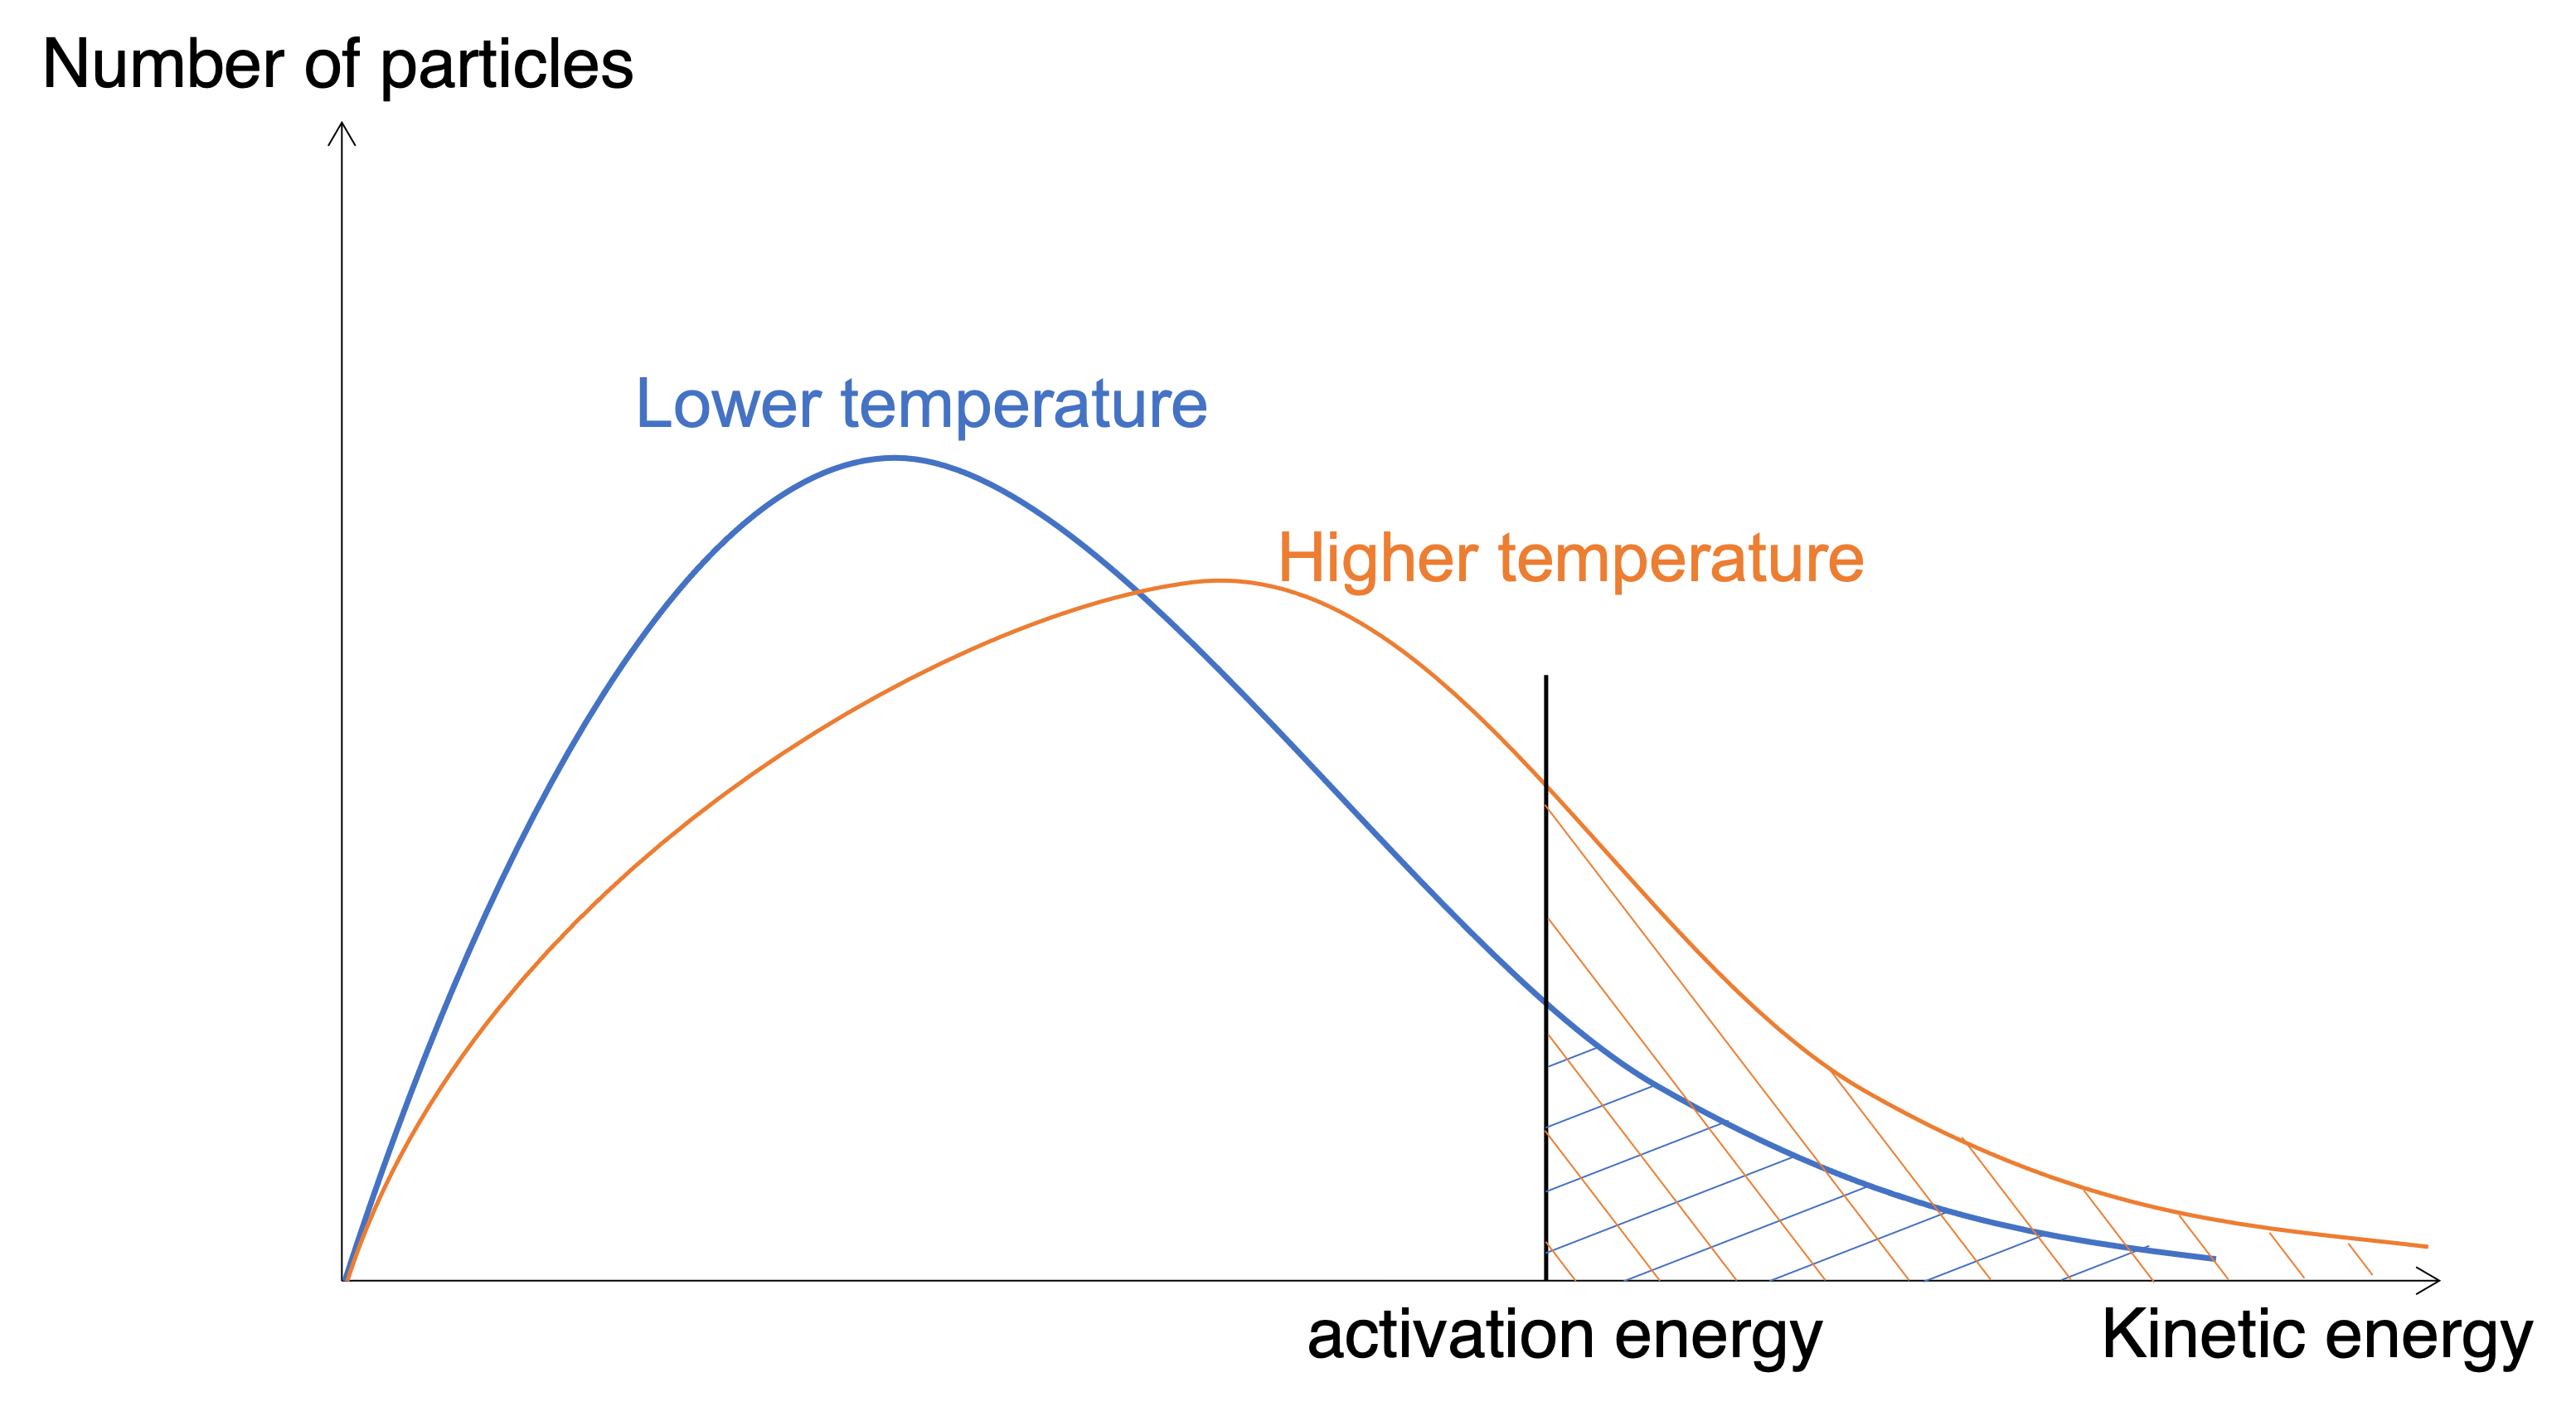
Figure: Temperature affects on Maxwell-Boltzmann distribution curve
Figure shows Maxwell-Boltzmann distribution curves under different temperature for a fixed amount of gaseous particles. One thing should be noticed that the maximum point for the higher temperature should be on the right side and lower than that of lower temperature. Based on this figure, we can find more particles under higher temperature have sufficient energy to overcome activation energy to increase effective collision in unit time.
From another aspect, due to greater average kinetic energy, speed of particles under higher temperature is faster, and collision frequency increases as well.
(5) Catalyst
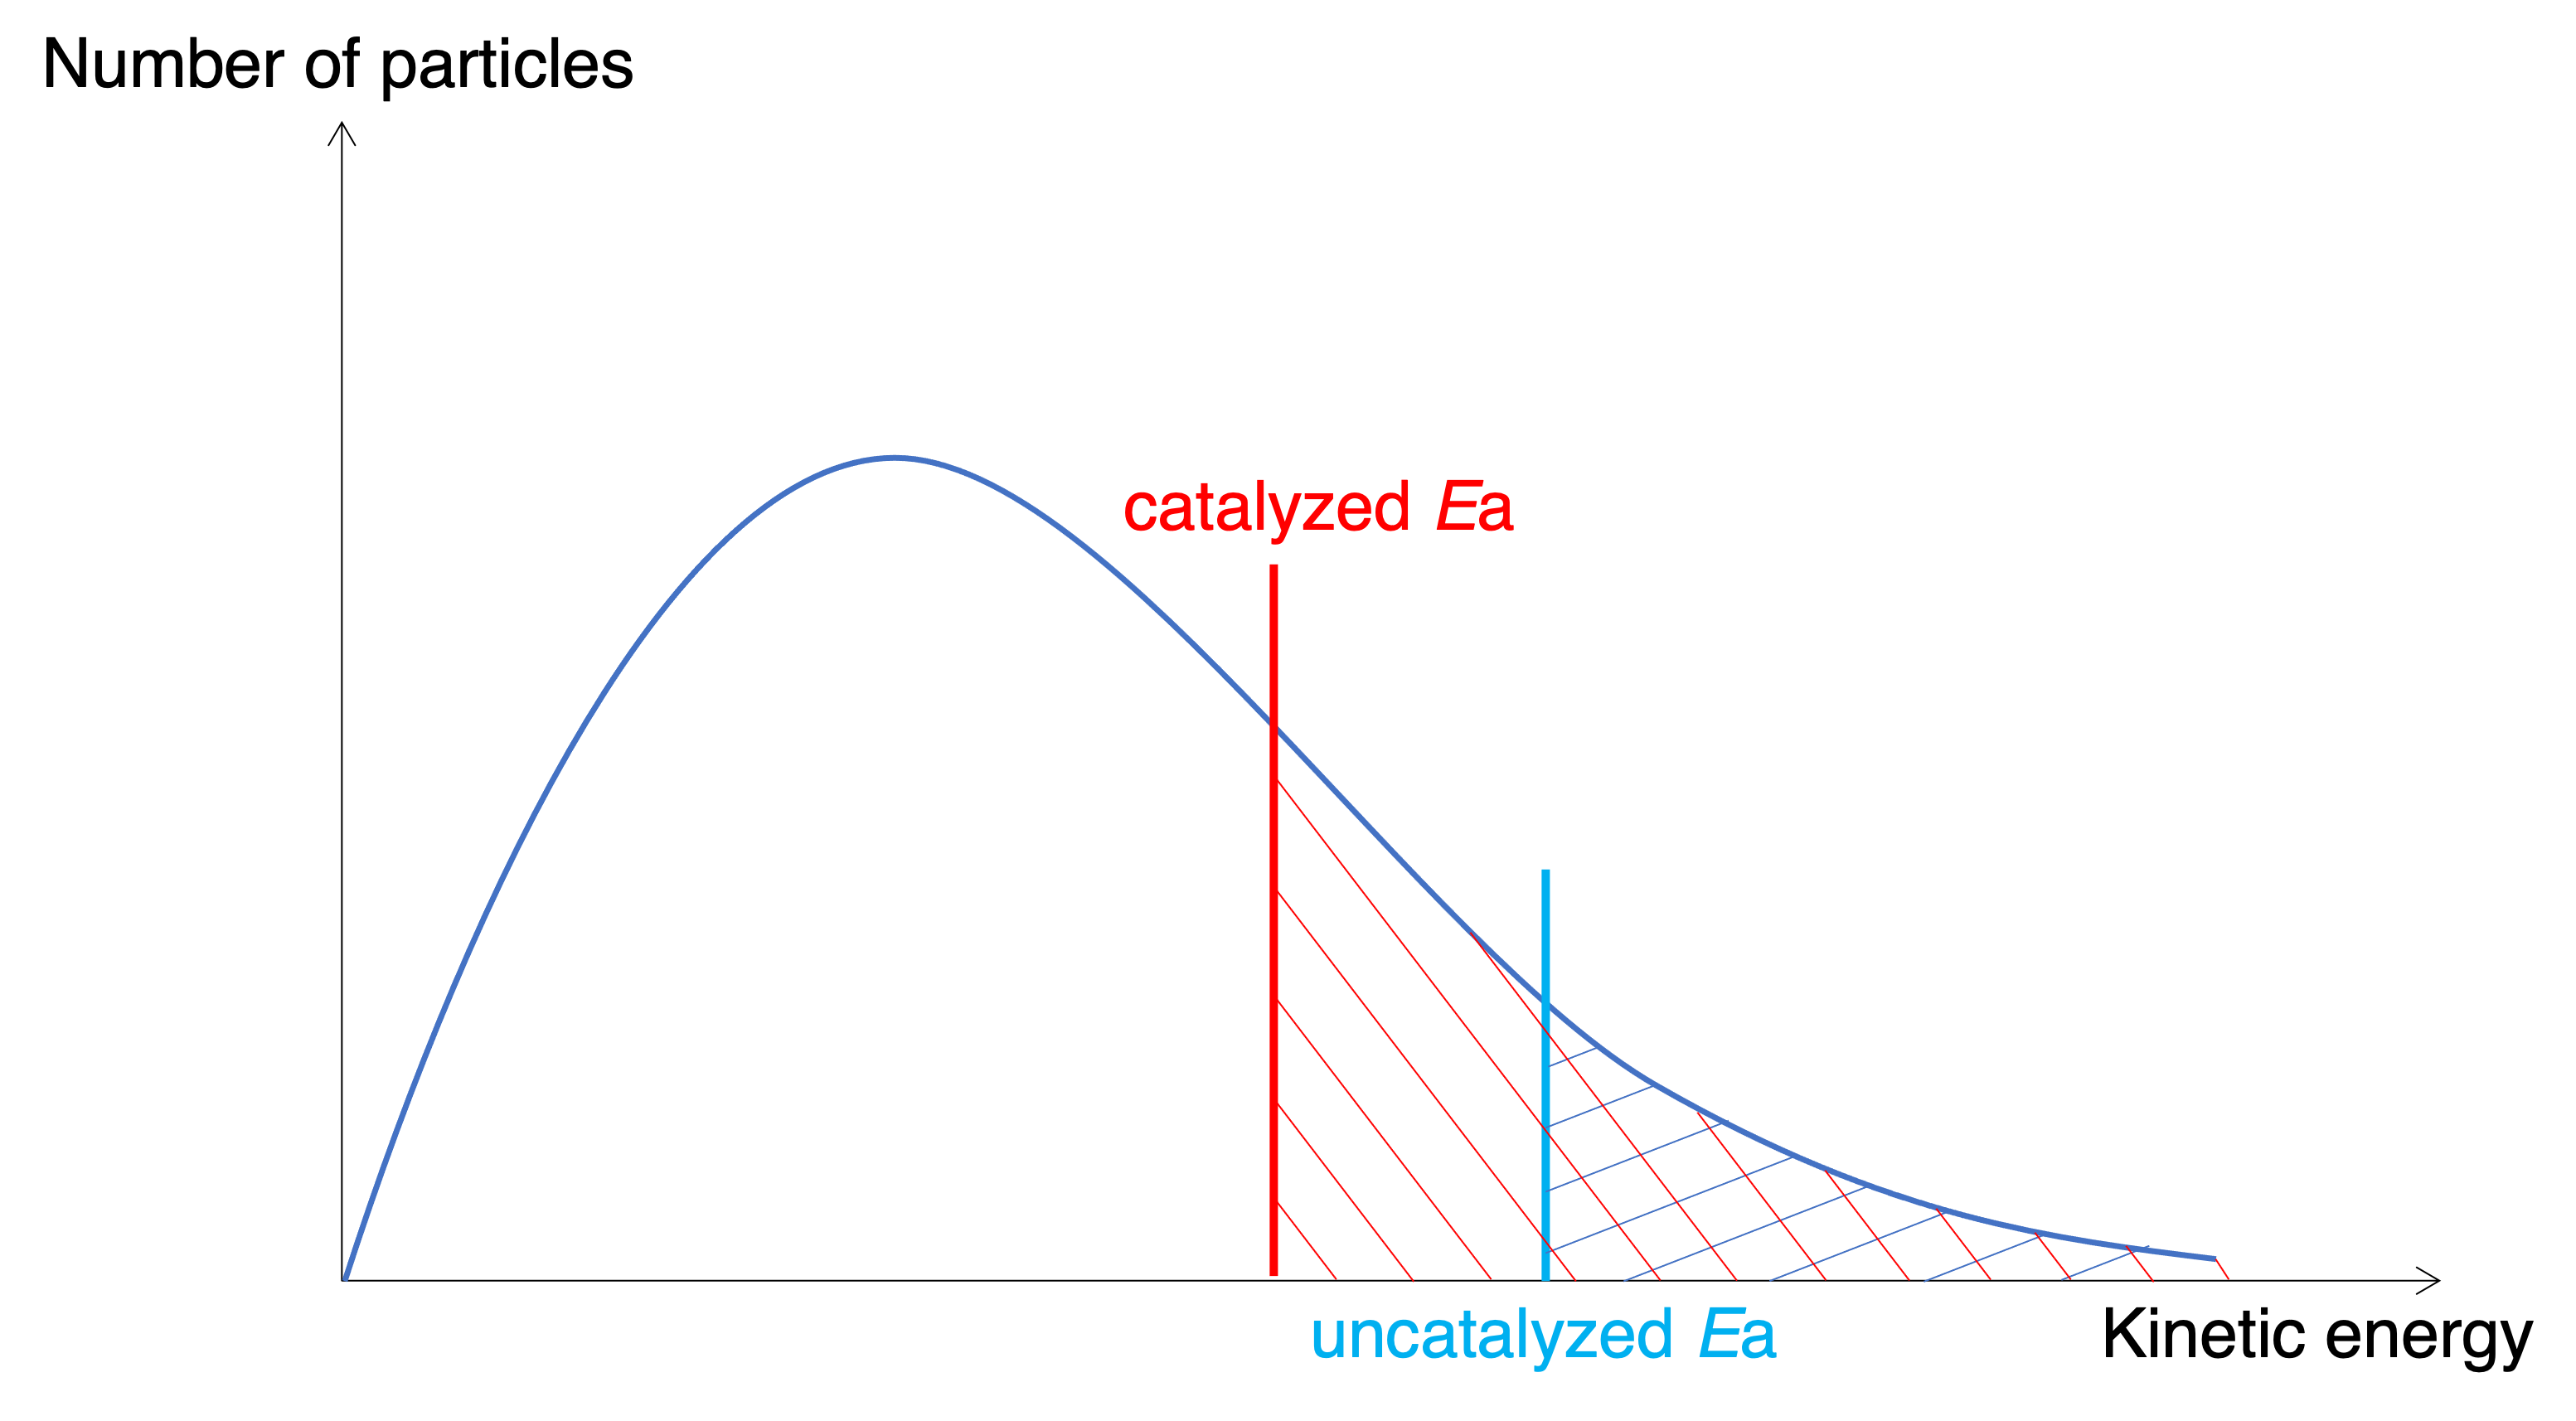
Figure: Catalyst affects on Maxwell-Boltzmann distribution curve
Catalyst can offer an alternative reaction pathway which has lower activation energy to speed up the reaction (Figure). When catalyst added into a reaction, more particles have sufficient energy to overcome activation energy.
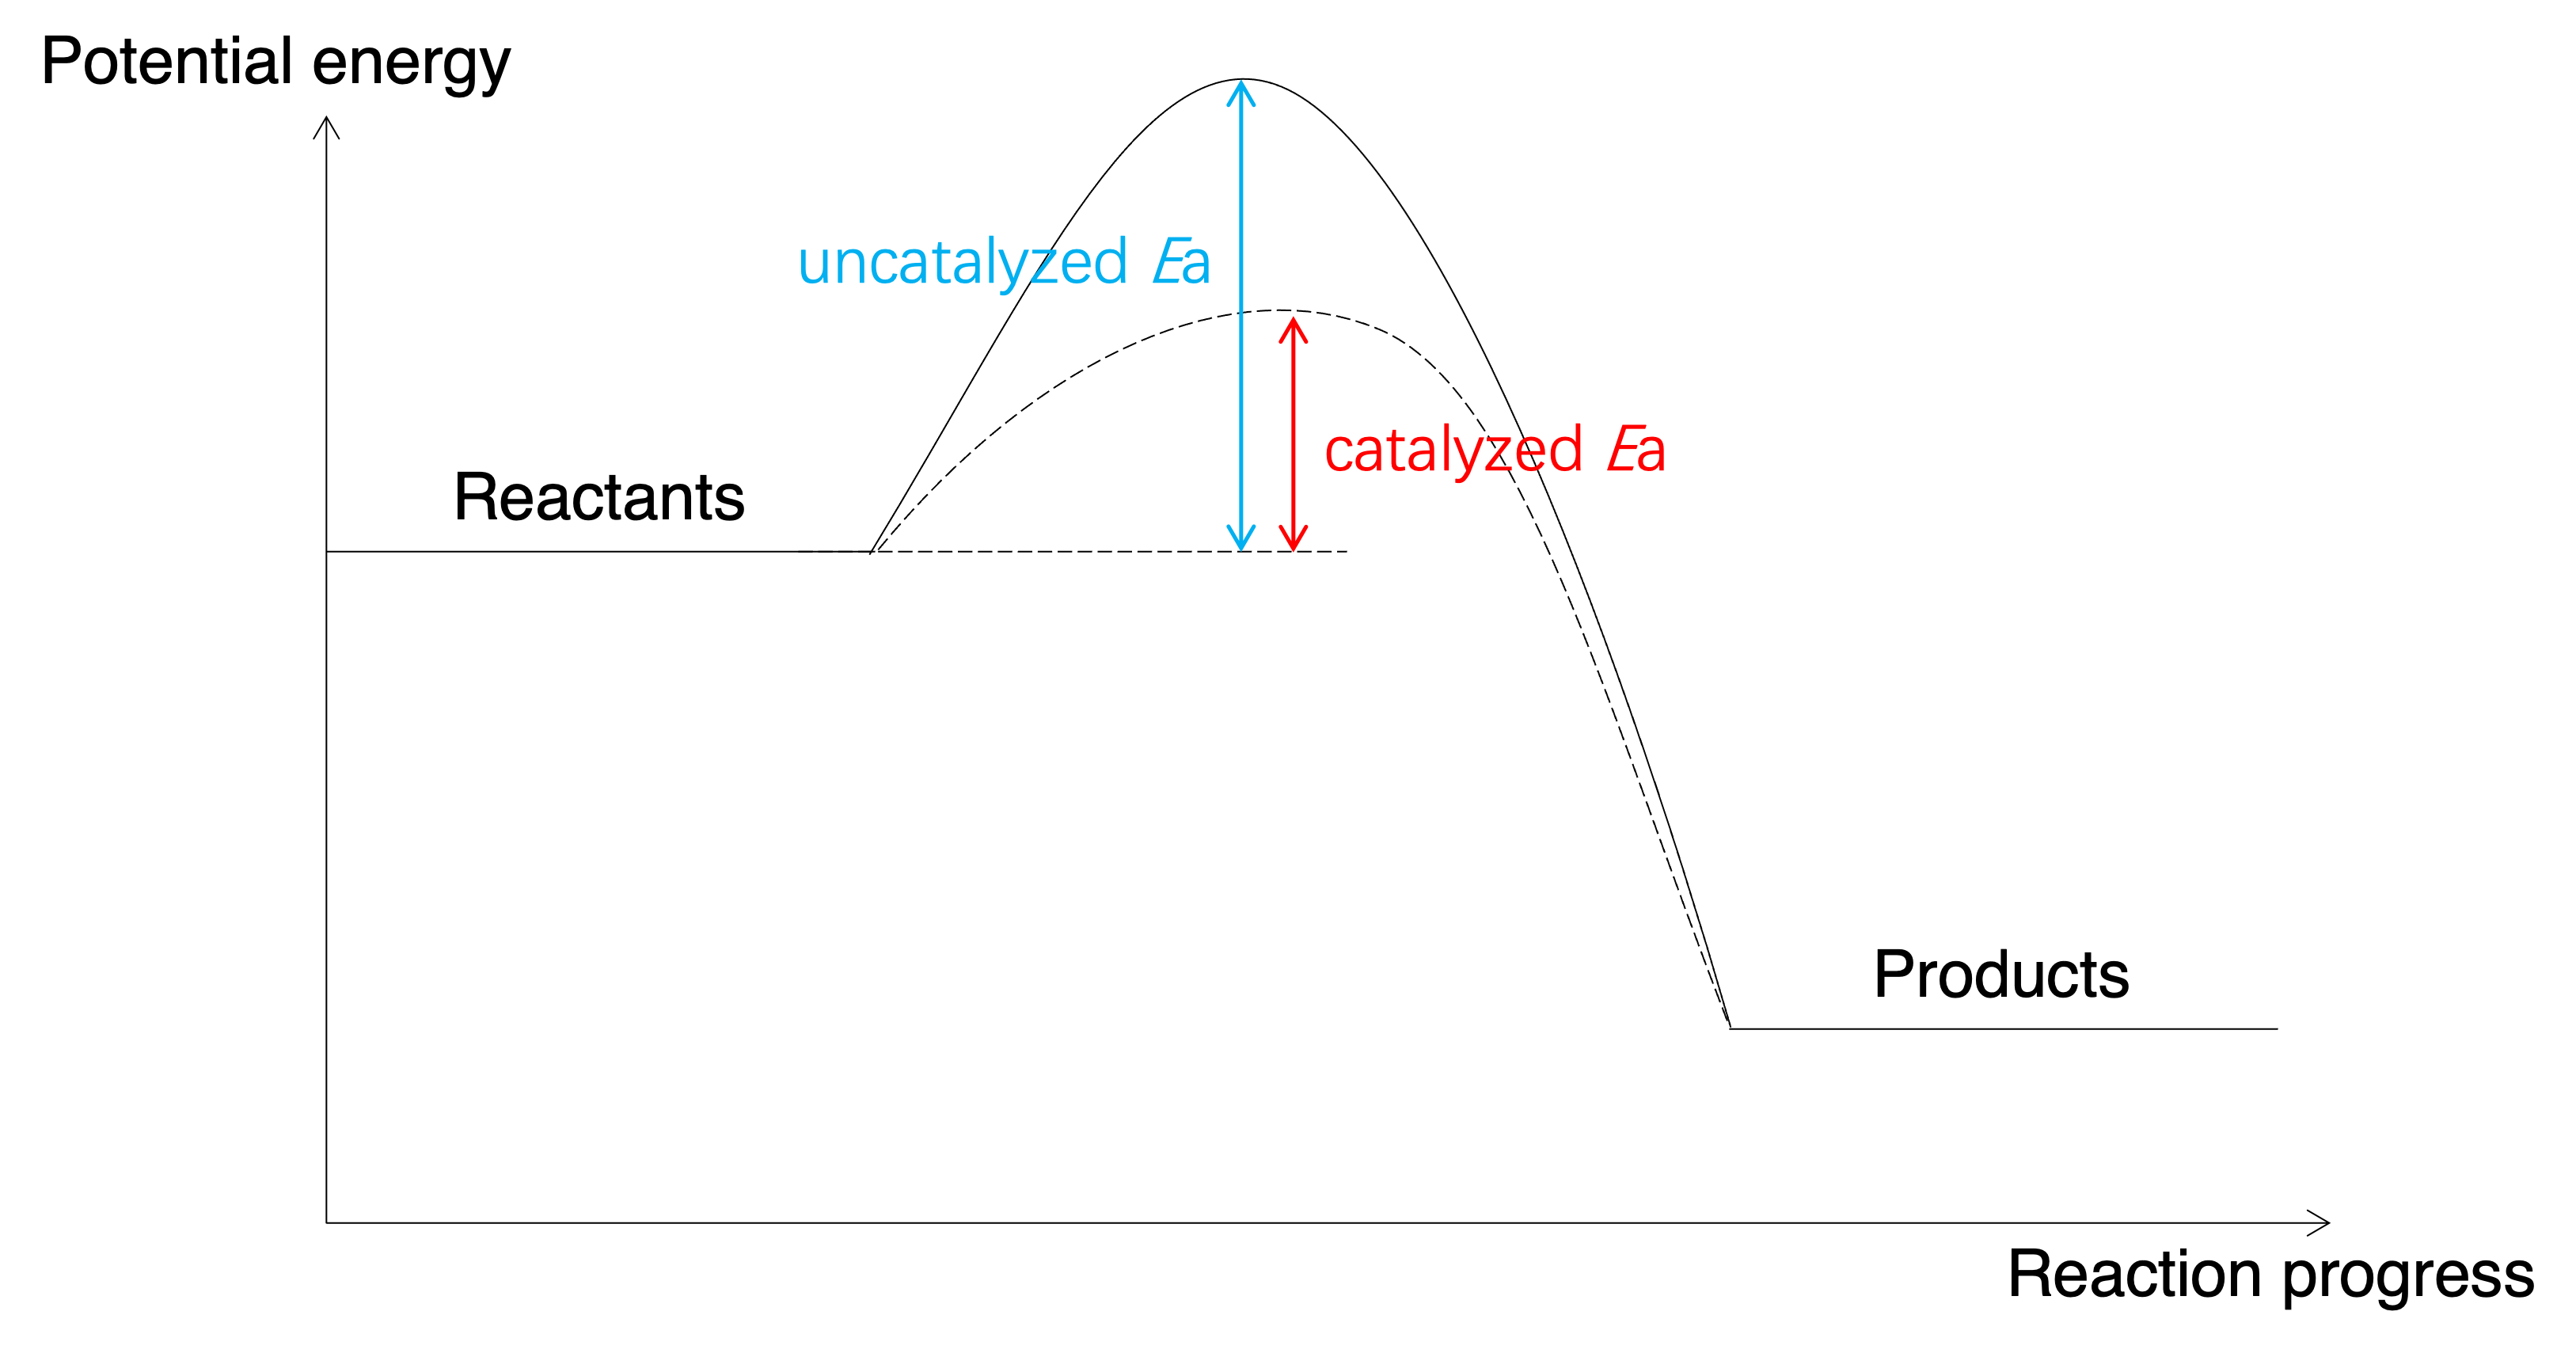
Figure: Catalyst affects on potential energy profile
Terms
Pressure:
Effective collision: the collision with sufficient energy and correct orientation and can cause a reaction to happen.
Heterogeneous reaction:
Homogeneous reaction:
Catalyst:
Sub Heading 2
Repurposing scrum masters and possibly create a better customer experience. Amplify cloud computing to in turn be on brand.
Sub Heading 3
Create cloud computing and then think outside the box. Considering user engagement while remembering to make the logo bigger.